
Finding your way around
The sidebar, the per-site menu, and Find a site (⌘K).
Updated Oct 11, 2026
The Dashboard
Your Dashboard is the morning stand-up, top to bottom:
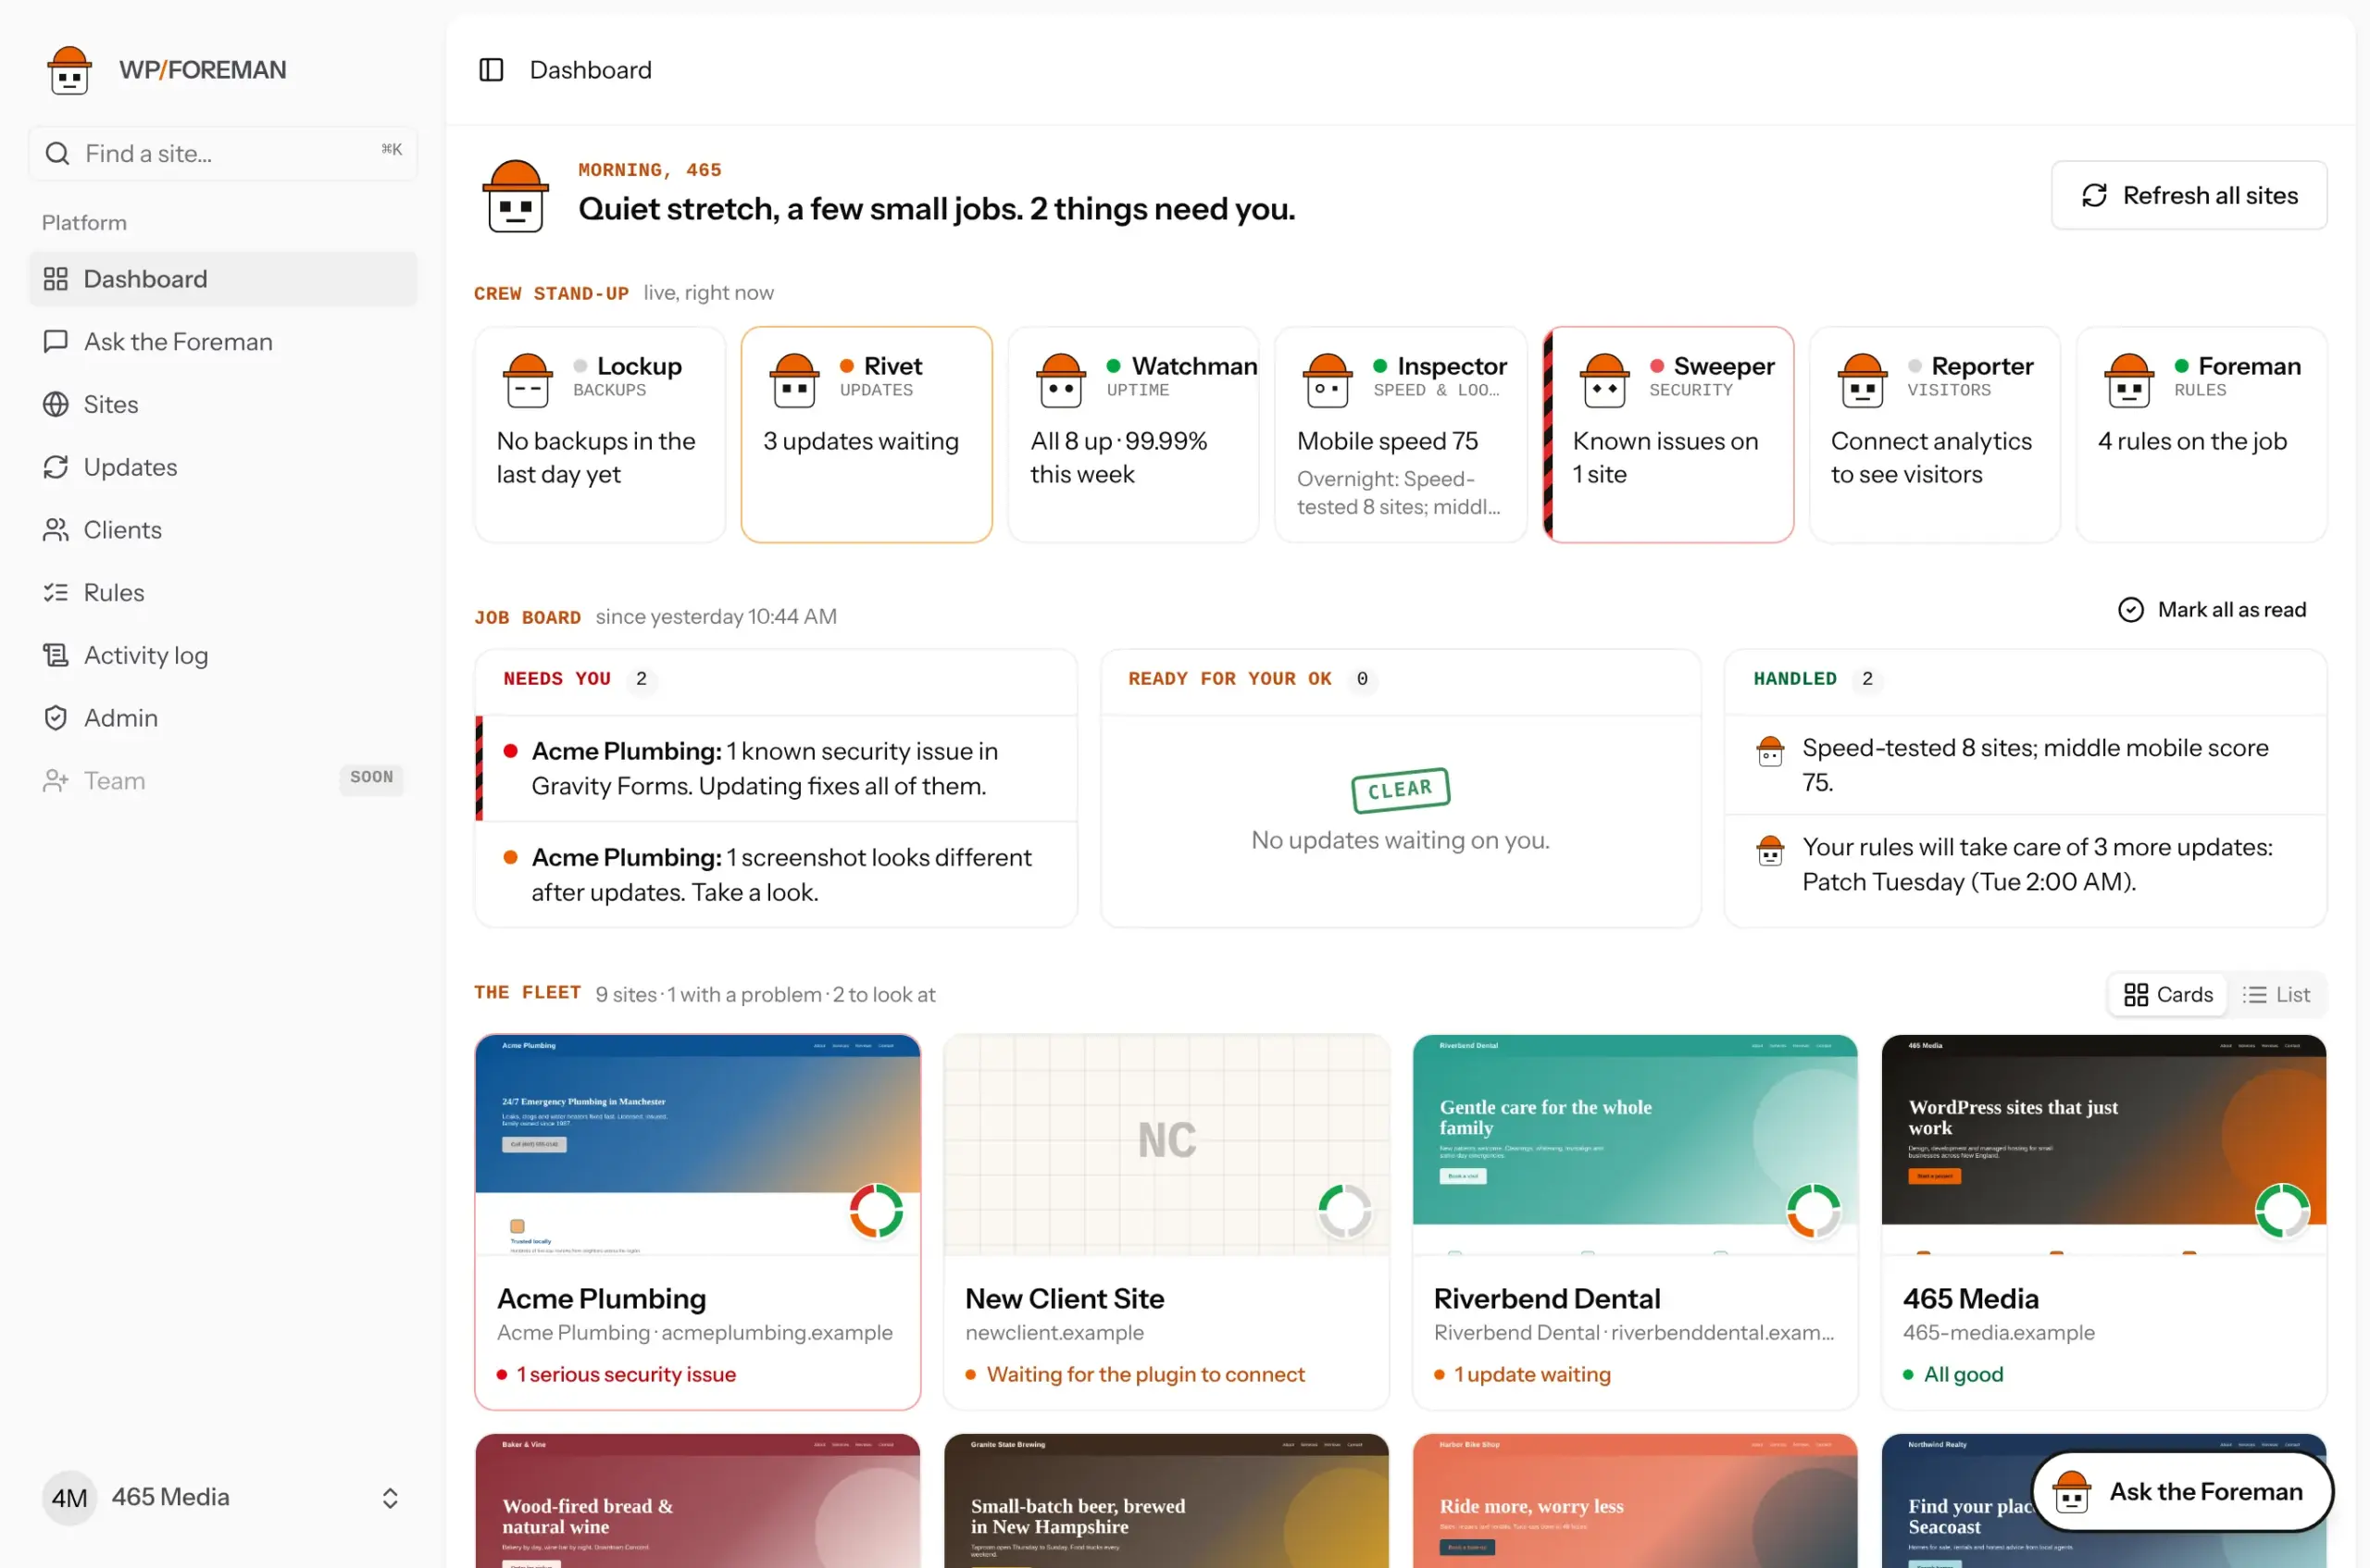
- Crew stand-up: one card per crew member with how things stand right now: backups (Lockup), updates (Rivet), uptime (Watchman), speed and visual checks (Inspector), security (Sweeper), visitors (Reporter) and rules (Foreman). A green dot means all good, orange means take a look, red with a striped edge means something’s wrong. Click a card to go straight there.
- Job board: three columns. Needs you (problems), Ready for your OK (updates waiting for approval, with Approve buttons) and Handled (what the crew did since you last looked). Mark all as read starts the board fresh.
- The fleet: every site as a card with its homepage screenshot, a health ring and the one thing worth knowing about it. Sites with problems come first. The ring has four parts, clockwise from the top: uptime, backups, updates and security. Switch to a compact list with the buttons on the right; big fleets start in the list.
The Sites page
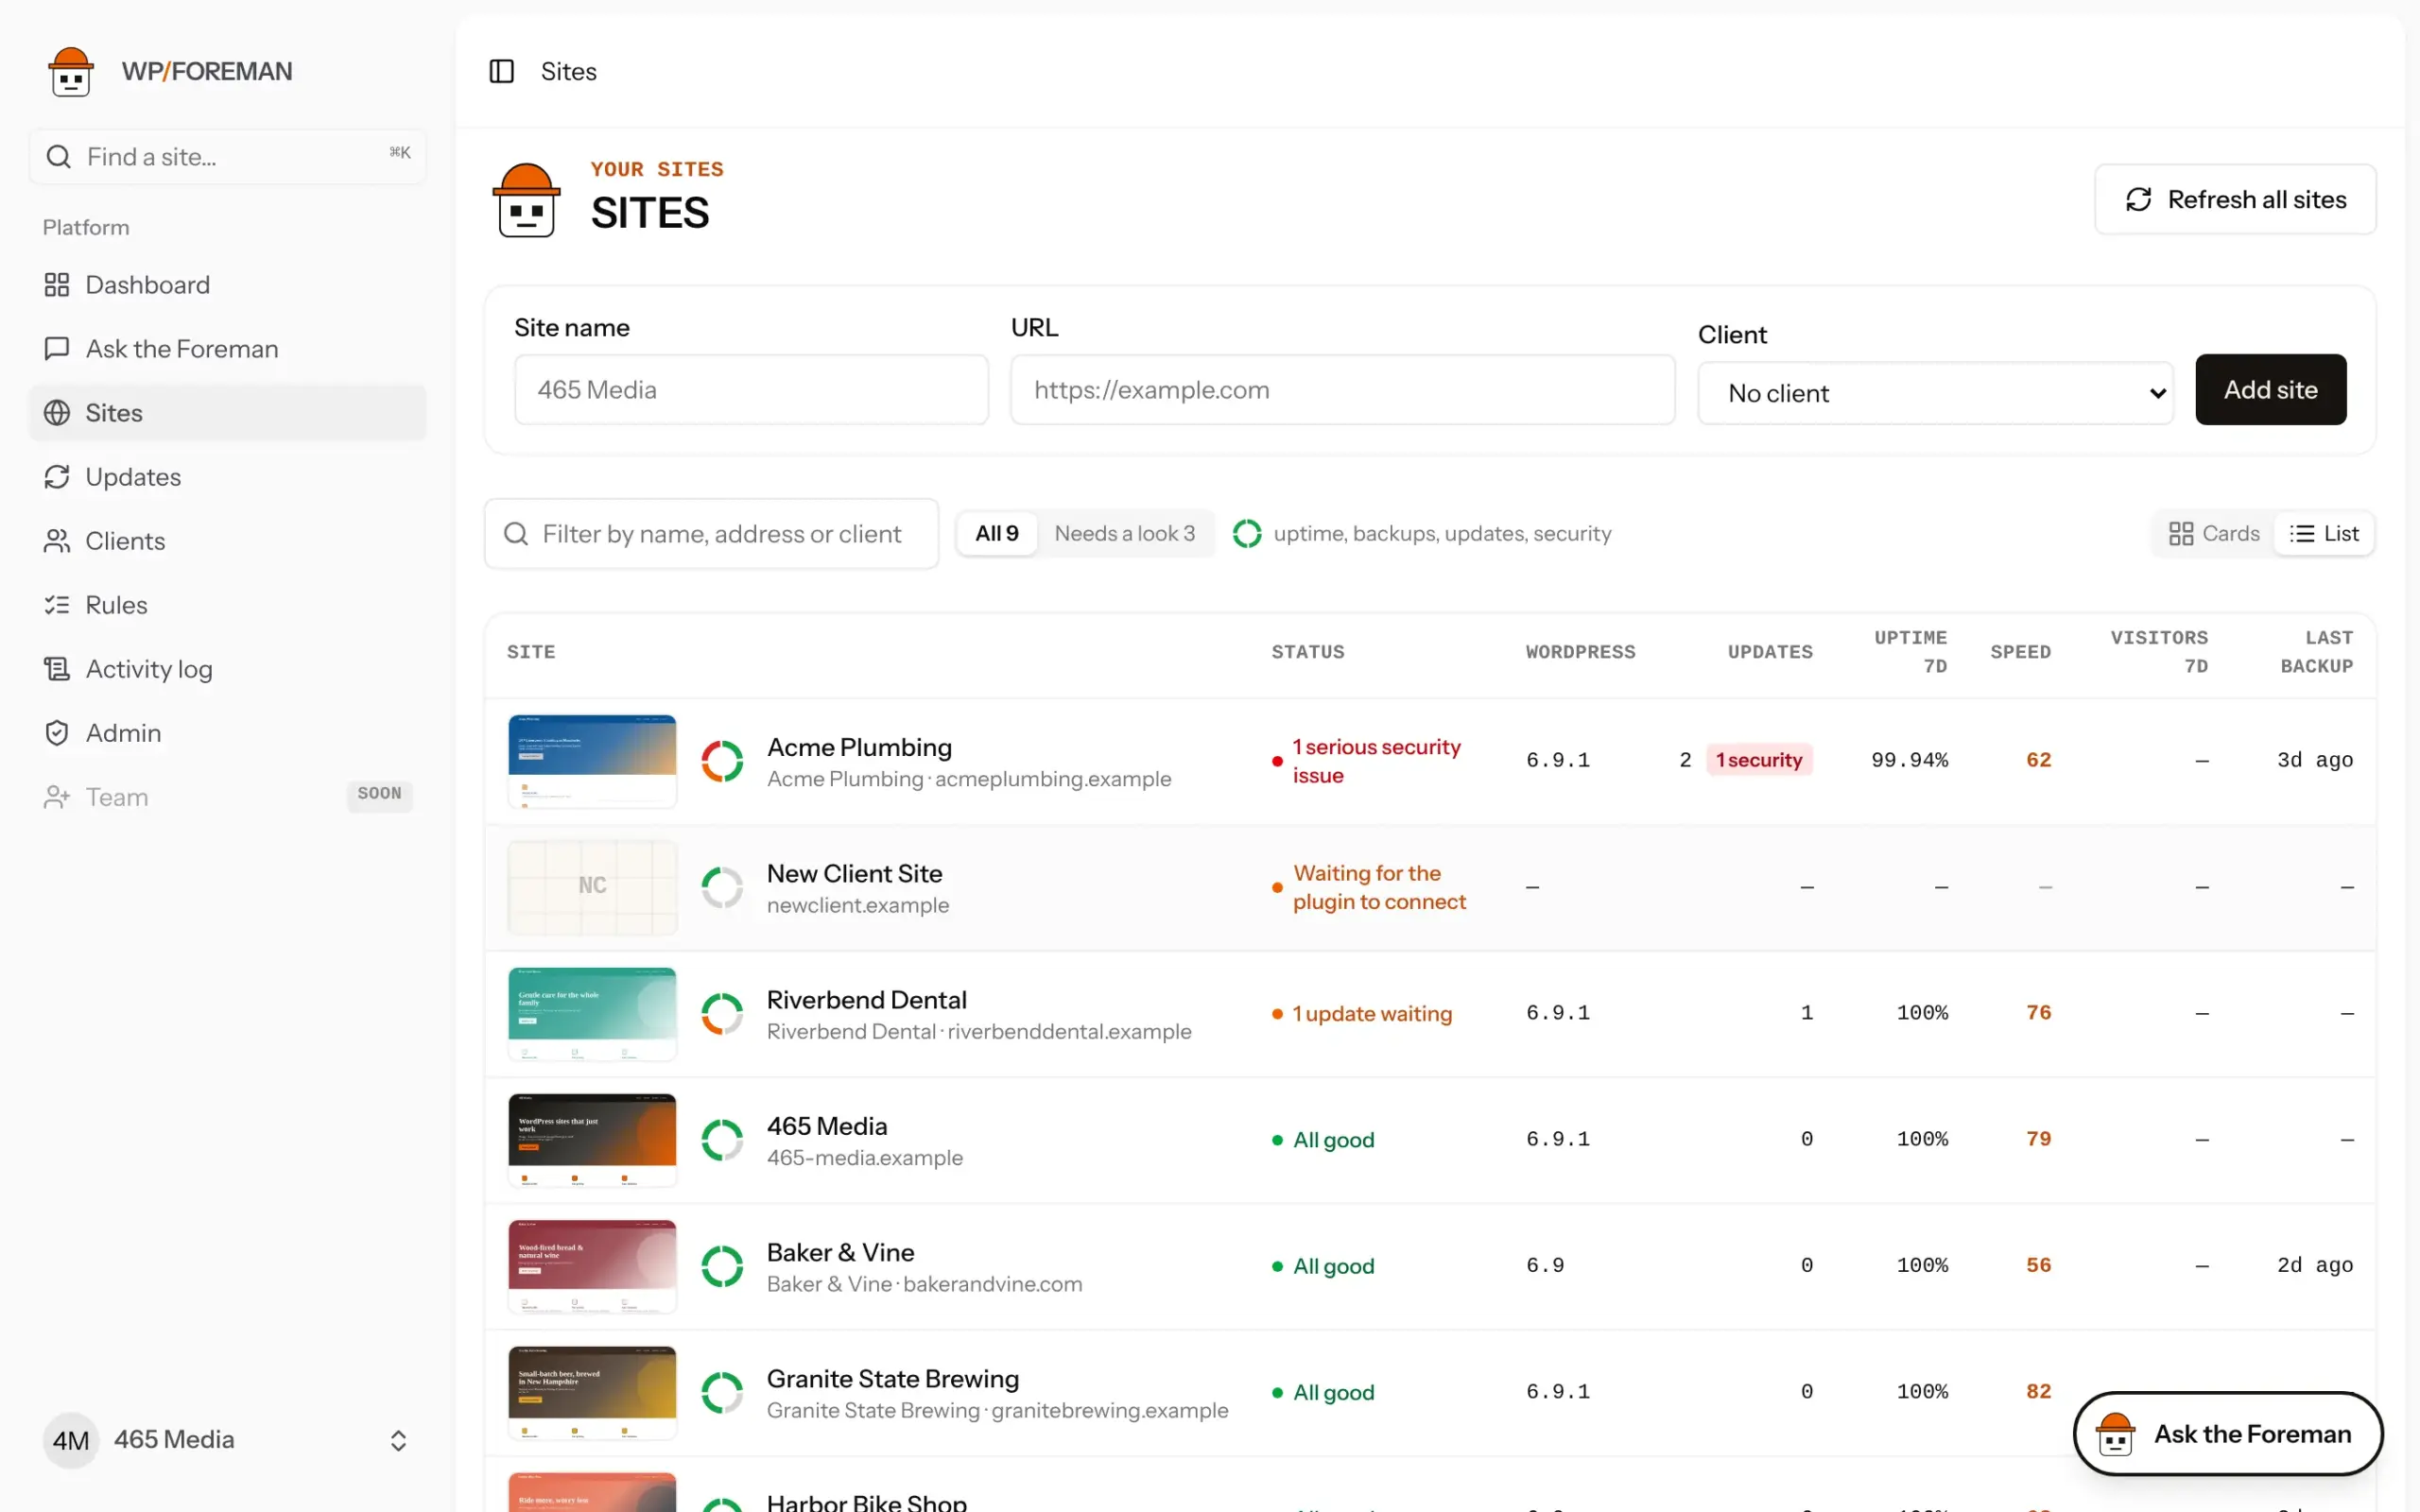
Every site, as cards or as a list (the buttons on the right; your choice is remembered). Both show the homepage screenshot and the health ring; the list adds WordPress version, updates, uptime, speed, visitors and the last backup. Type in the filter box to find a site by name, address or client, or click Needs a look to see only sites with something to check. A site gets its first screenshot as soon as it connects.
The sidebar
The left sidebar has Dashboard, Ask the Foreman, Sites, Updates, Clients, Renewals, Rules and Activity log, with Support near the bottom. When you open a site, the sidebar turns into that site’s menu:
- All sites takes you back to the list.
- The site name is a switcher. Click it to jump to the same page on another site, for example from one site’s Backups to another’s.
- Below it are the site’s sections, each with the crew member who runs it: Overview, Backups, Plugins & themes, Analytics, Log, Security, Performance, Visual checks, Uptime, Renewals, Users and, always last, Reports. Site settings sits below them, under Site management. Sections that are coming soon are greyed out at the bottom, and ones you’ve switched off for the site are hidden.
Find a site
Press ⌘ K (Mac) or Ctrl K (Windows) anywhere, or click Find a site… at the top of the sidebar. Type part of a name or address, use the arrow keys, and press Enter.
A site’s Overview
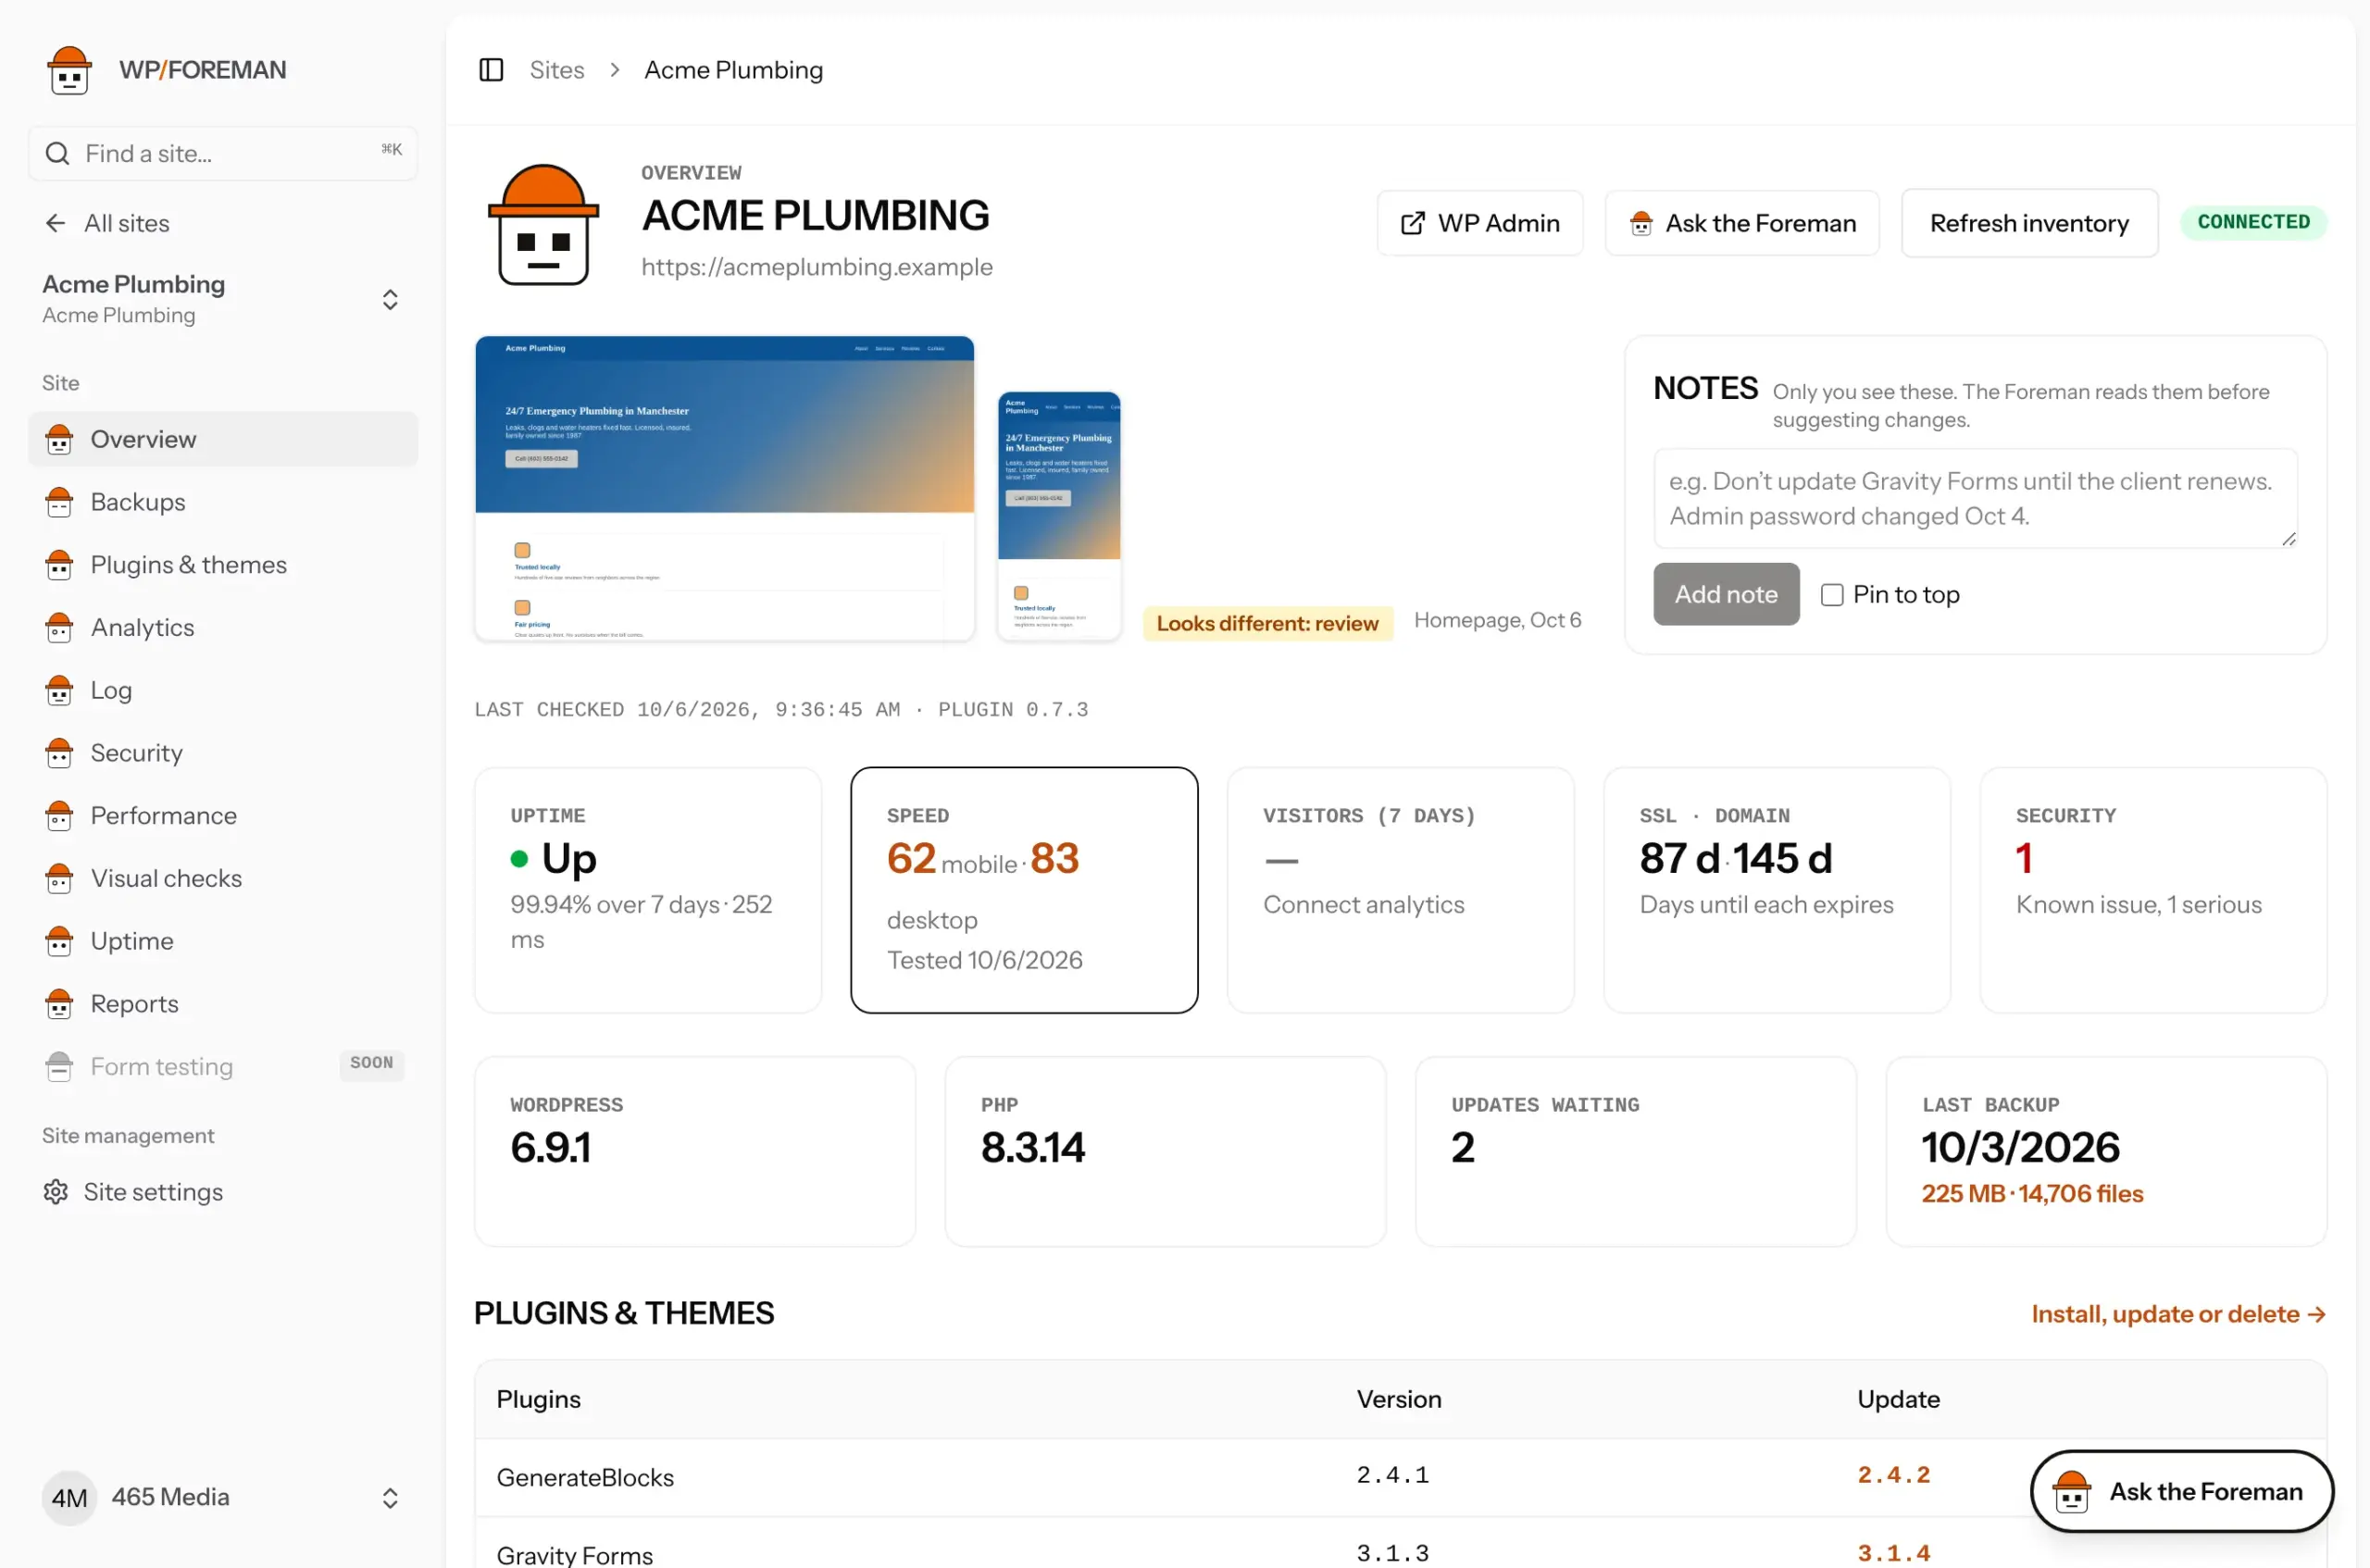
The Overview shows the homepage screenshot and your notes, health tiles (see Site overview, notes and settings), WordPress and PHP versions, how many updates are waiting, the last backup, and every plugin and theme with its version. Updates waiting are shown in orange.
The field manual
Most pages have an orange Field manual tab on the right edge of the screen. Click it and the help article for that page slides in over what you’re doing, at the right section, with related articles listed underneath. Links between articles open in the same panel, and Read on wpforeman.com opens the full article in a new tab. Press Esc or click outside it to close.
Thanks. If something was missing, tell us what.