
How uptime monitoring works
The Watchman checks every site every minute from Cloudflare's network, confirms a problem from other regions before calling it down, and tells you when it's back.
Updated Oct 11, 2026
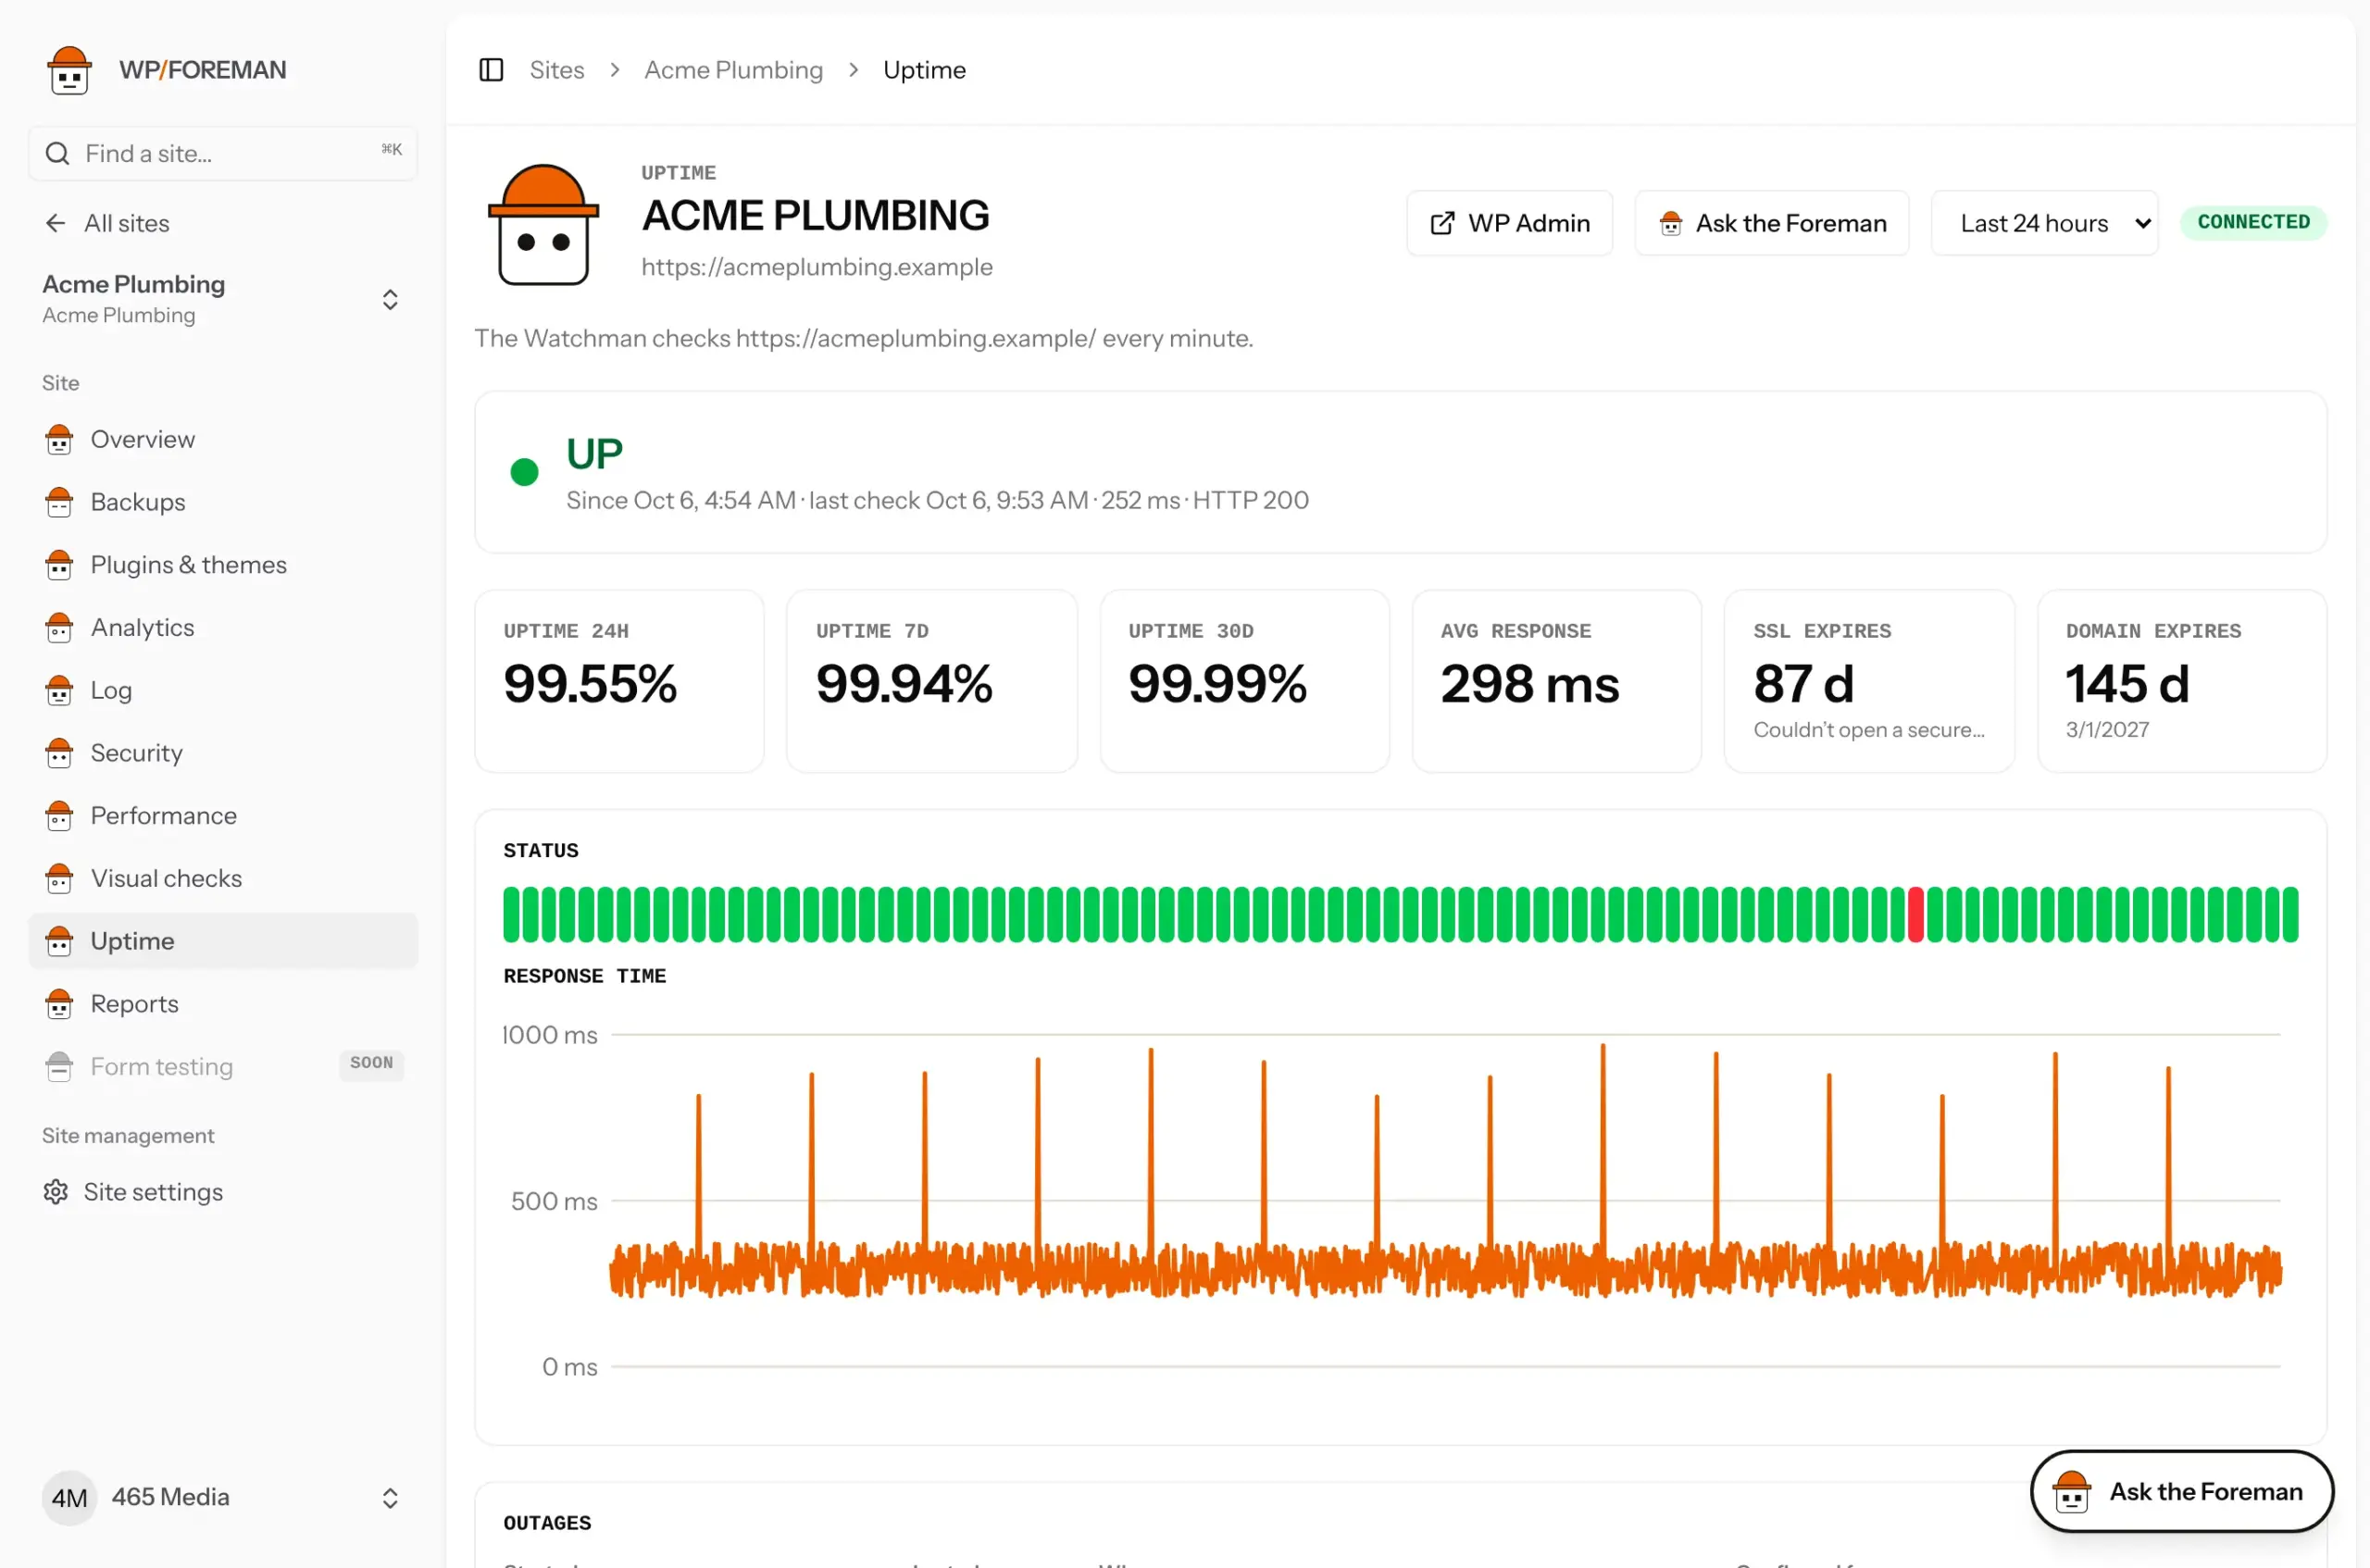
Every site in WP Foreman gets uptime monitoring automatically. Nothing to install. Open a site and choose Uptime to see it.
What gets checked
- Every minute, the site’s home page (or a page you choose) is loaded from Cloudflare’s global network.
- A check passes when the page answers within 15 seconds with a normal status (under 400, after following redirects) and, if you set one, contains your keyword.
- Response time is the time to the first byte of the page.
When does it count as down?
False alarms are worse than no alarms, so a site is only marked down when all of this is true:
- The check fails.
- It fails again 3 seconds later.
- At least one checker in another region (we ask two: eastern US and western Europe) also fails. If neither can be reached, the two failures are enough.
If the other regions can load the site, it’s treated as a network blip between one Cloudflare location and the host: it’s noted on the Uptime page but nobody gets an email.
What the statuses mean
| Status | Meaning |
|---|---|
| Up | The last check passed. |
| Down | Confirmed down, see above. An outage is open until a check passes again. |
| Blocked by firewall | The site’s firewall or bot protection answered with a challenge page (“Just a moment…”, captcha), so we can’t tell if it’s up. Not counted as downtime. See the fix below. |
| Waiting for first check | New site, or checks were just switched on. |
Reasons you’ll see
| Reason | Usually means |
|---|---|
| server error (500, 502, 503…) | PHP crashed, the database is down, or the host is overloaded. |
| page error (404, 403…) | The page you’re checking moved, or something is blocking it. |
| no answer within 15 seconds | The server is overloaded or stuck. |
| couldn’t connect to the server | The server or web service is off. |
| the domain didn’t resolve (DNS) | DNS records changed or the domain lapsed. |
| the secure (SSL) connection failed | The certificate is broken or expired. |
| the page loaded but “…” was missing | Your keyword wasn’t on the page: a white screen, a maintenance page, or a hacked home page. |
Settings for each site
At the bottom of a site’s Uptime page:
- Check this site every minute: switch checks off for sites you don’t want monitored.
- Page: check a different page, for example
/shopor/contact. Start with/. - Must contain: a word or phrase that’s always on the page, like the company name in the footer. This is the best way to catch a “white screen of death”, which still answers 200 OK.
Changes reach the checkers within 5 minutes.
Alerts
- One email when a site goes down (with the reason and which regions confirmed it) and one when it’s back (with how long it was down). Turn them off in Settings › Notifications.
- Outages show in the site’s Log (category Uptime), the morning report and, while ongoing, under Needs you.
- Rules: new triggers A site goes down and A site comes back up. For example, send Slack a message through the
rule.ranwebhook. See Rules reference. - Webhooks:
site.downandsite.up. See Webhooks.
“Blocked by firewall”: how to fix it
Allow our checker through the site’s firewall:
- Cloudflare (the client’s site is on Cloudflare): Security › Bots, switch off Bot Fight Mode, or add a WAF custom rule User Agent contains
WPForeman-Uptime→ Skip. - Wordfence, Sucuri, host firewalls: allow the user agent
WPForeman-Uptime.
Uptime percentages
Uptime % is passed checks divided by all checks over 24 hours, 7 days or 30 days. Blips and “blocked” checks don’t count against it. Per-minute detail is kept for 48 hours; after that it’s kept as hourly totals for good, which is what monthly reports use.
Ask the Foreman: “Has Acme Plumbing had any downtime this month?” or “When does the SSL certificate on Acme expire?”
Thanks. If something was missing, tell us what.