
Site speed (PageSpeed)
The Inspector runs Google PageSpeed on every site daily, mobile and desktop, tracks the score over time and tells you when it drops.
Updated Oct 6, 2026
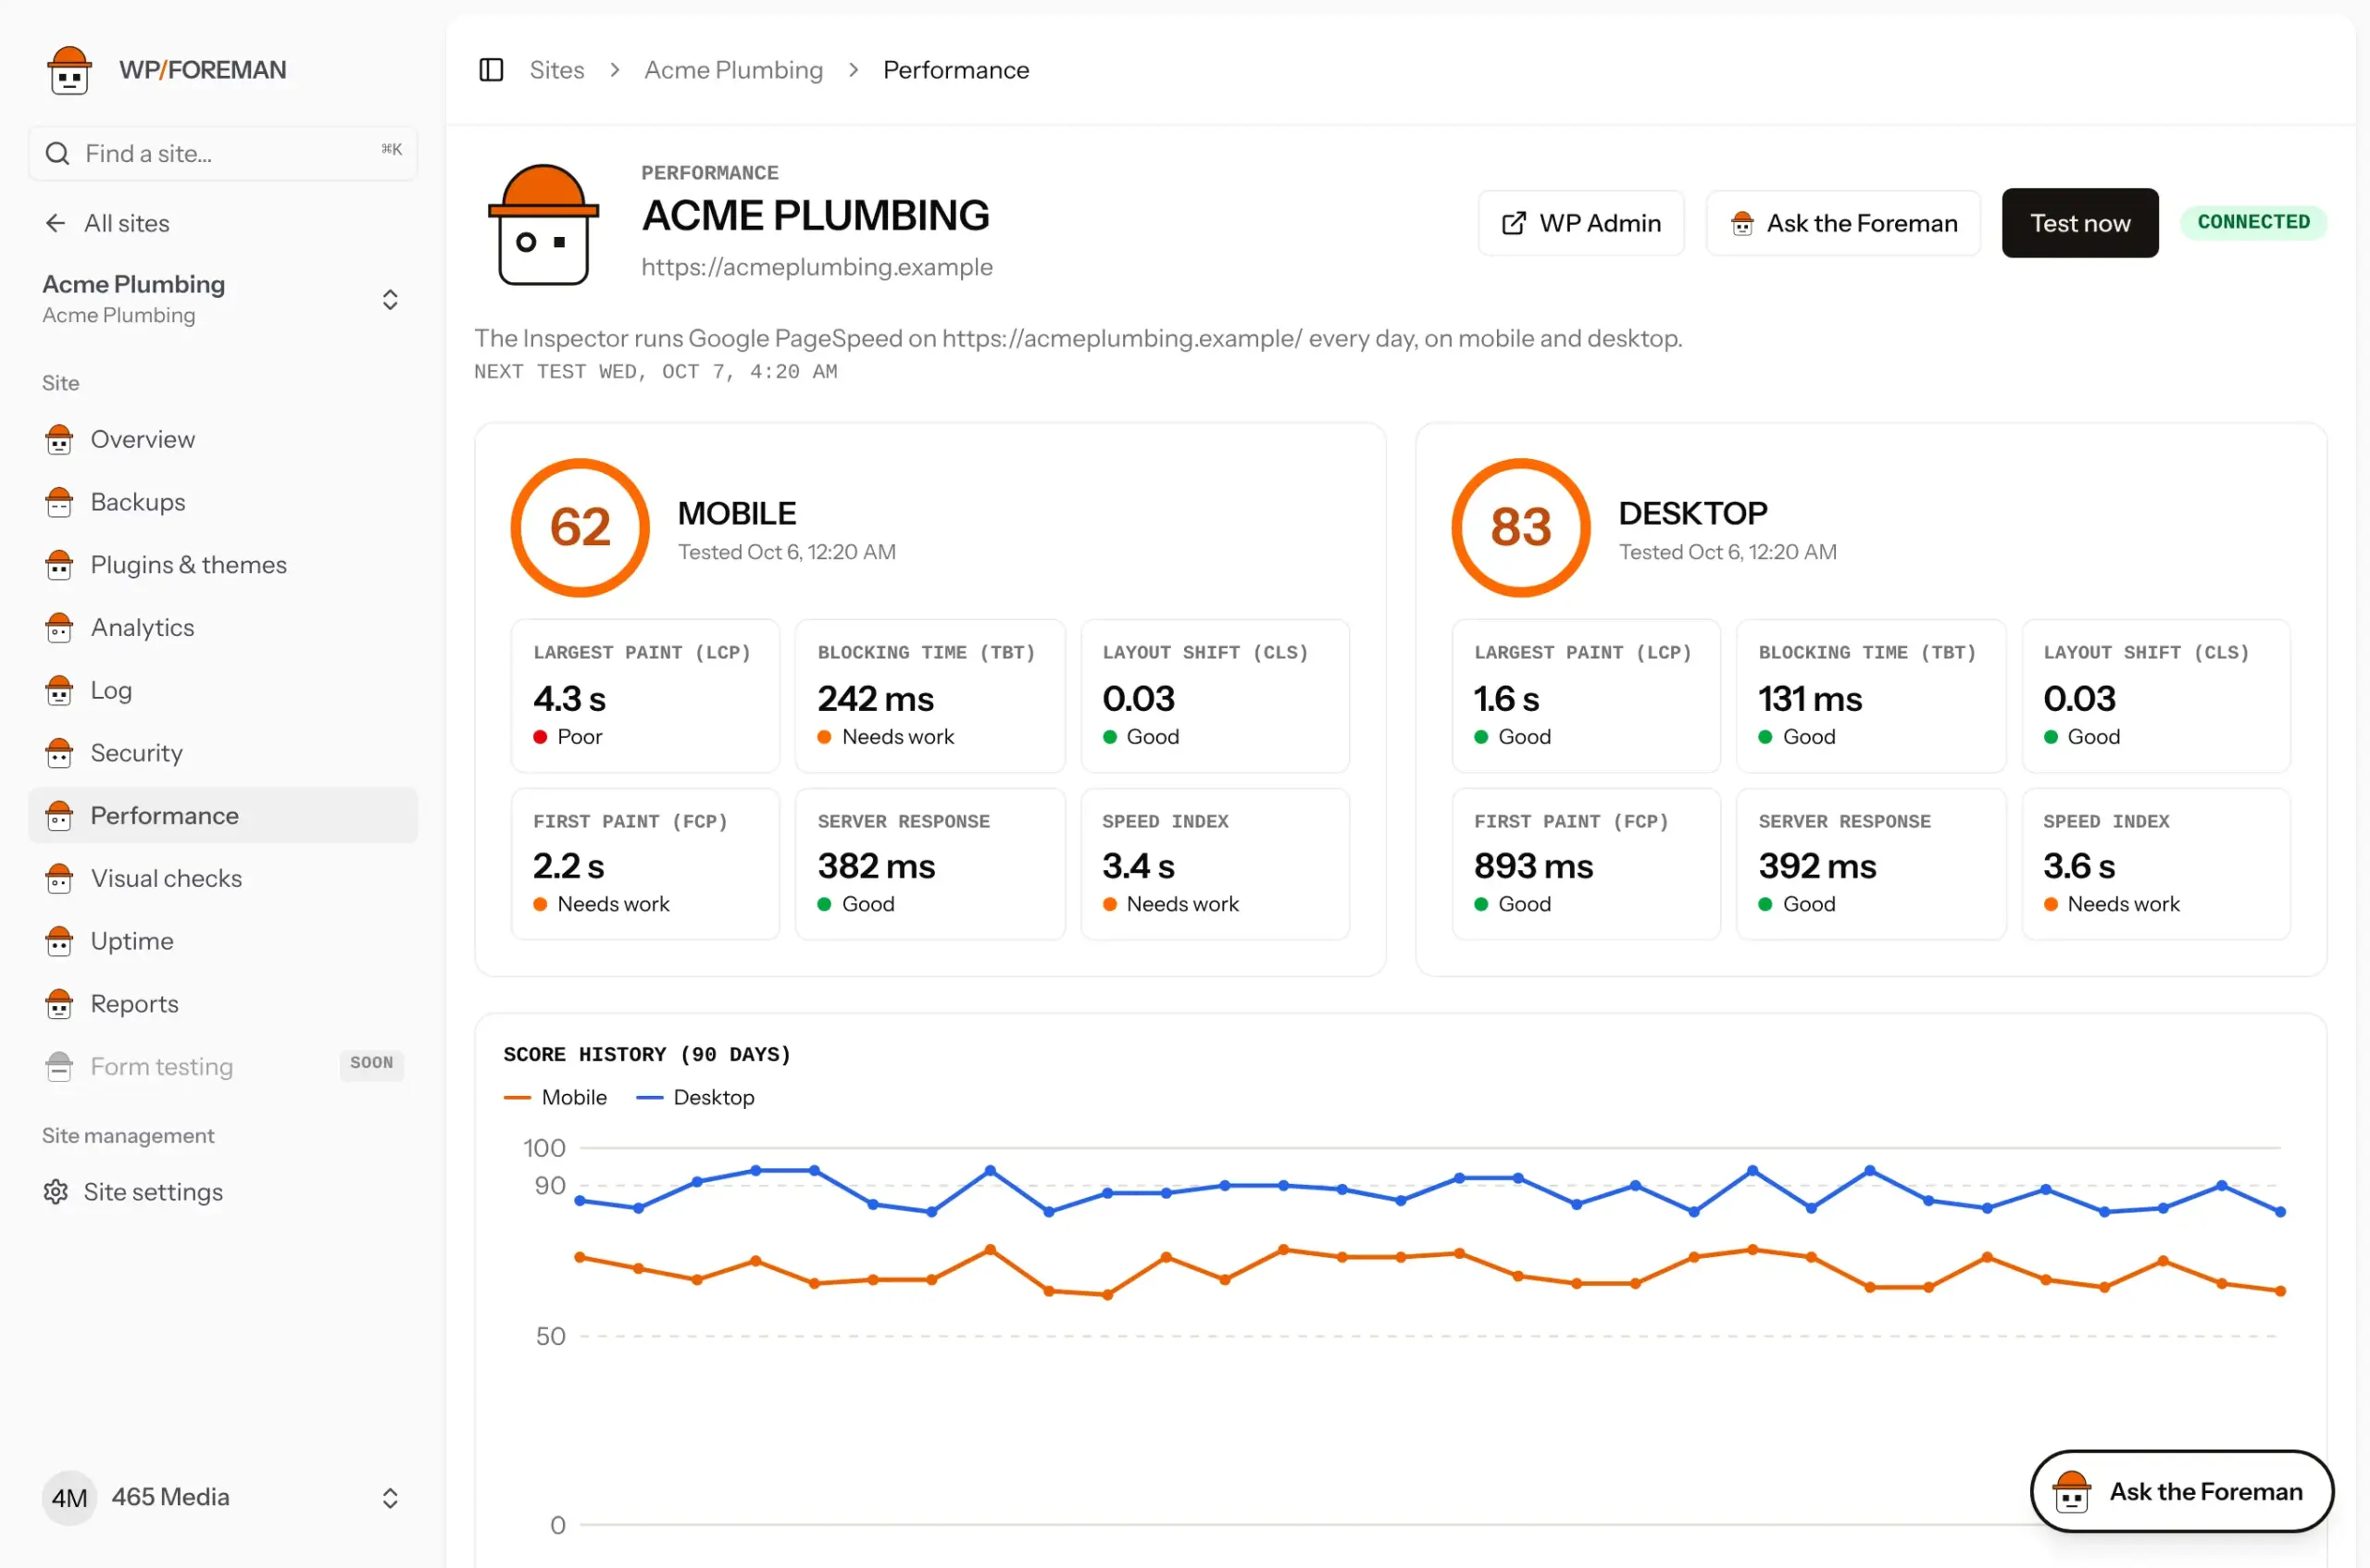
Every site gets a daily speed test from Google PageSpeed Insights, the same tool at pagespeed.web.dev, on both mobile and desktop. Open a site and choose Performance.
What you’ll see
- Score (0–100) for mobile and desktop. Green 90+, orange 50–89, red under 50: Google’s own bands.
- Lab measurements from that test, each marked Good, Needs work or Poor using Google’s thresholds (table below).
- Real visitors (Core Web Vitals): what actual Chrome users experienced over the last 28 days, when Google has enough visits to report. Small sites often don’t; then this section doesn’t show. If the page itself doesn’t have enough data, the whole site’s numbers are used and it says so.
- Biggest wins: the changes Google estimates would help most on mobile, with the time they’d save.
- Score history for 90 days, mobile and desktop. The chart starts once there are tests on two different days.
- Every test: a table of every test in the last 90 days, newest first, with both scores and the main mobile measurements. Click a row to see that test in full, including what Google suggested fixing at the time. Show more loads older tests.
The measurements
| Measurement | What it means | Good |
|---|---|---|
| Largest paint (LCP) | When the main content (usually the hero image or headline) appears. | under 2.5 s |
| Blocking time (TBT) | How long scripts freeze the page so it can’t respond. Lab stand-in for responsiveness. | under 200 ms |
| Responsiveness (INP) | Real visitors only: how quickly the page reacts to clicks and taps. | under 200 ms |
| Layout shift (CLS) | How much things jump around while loading. | under 0.1 |
| First paint (FCP) | When anything first appears. | under 1.8 s |
| Server response | How fast the server answers before anything else can happen. Slow here usually means hosting or no page cache. | under 800 ms |
Mobile scores are always lower: Google tests on a simulated mid-range phone on a slow connection. Scores also move a few points between runs for no reason. Watch the trend, not one test.
When it runs
- Daily at 08:20 UTC (4:20 AM Eastern) for every site with tests on. The page shows when the next test is. A new site shows First test with the date and time until its first one runs.
- Test now runs it immediately. It takes about a minute at Google’s end; refresh to see results.
- At the bottom of the page: switch daily tests off, or test a different page (for example
/shop).
Score drops
If a site’s mobile score is 10 or more points below its average of the last 7 tests, the Inspector logs it (category Performance), it appears in your morning report, and:
- Rules can react: trigger A site’s mobile speed score drops 10+ points. See Rules reference.
- Webhook
performance.dropped. See Webhooks.
A drop the morning after updates is a strong hint which update did it. Check the site’s Log.
If a test fails
| Message | Fix |
|---|---|
| Google couldn’t load the page | The site was down, blocks Google, or redirects in a loop. Check Uptime. |
| Daily PageSpeed limit was reached | Nothing to do; it tries again the next day. |
Ask the Foreman: “How fast is Acme Plumbing on mobile, and what should we fix first?”
Thanks. If something was missing, tell us what.